Hours Chart

February 12, 2009

Hours

hours

How many hours is your team spending on projects every week? Hours chart shows a bar chart of hours spent by all people on projects.

Put this to use!
As you may expect, this will give you a quick analysis if team is over-worked or under-worked. When you correlate the amount of hours worked with iteration or burndown chart, you can see what category of work could have taken time each week. A sudden fall in hours may indicate team reduction or vacation. A sudden rise may mean increase in team or overtime!

We have kept provision for estimated hours in the system, but you won’t see any data for it now. It’ll come in another module!

Iteration Chart

February 12, 2009

Iteration Chart

iteration-chart

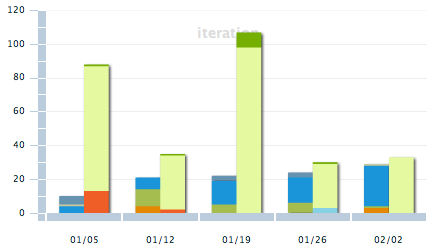
Iteration chart shows you number of open and closed tickets in different categories. This helps you assess what kind of work is getting done every week. Categories are pulled from your Master Categories list in activeCollab.

Put this to use!
If you see open tickets rise in a week, it means work has increased. Closed counts increasing is a good sign – it means things are getting done. Depending on how you have organized your categories, this chart can give you a bird’s eye view of progress on your projects.

Burndown Chart

February 12, 2009

Burn down Chart

burndown-chart

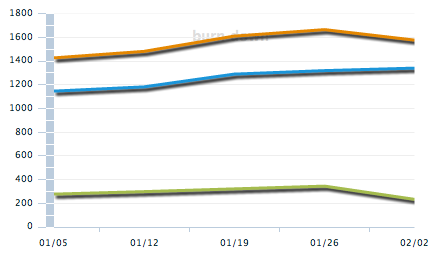
Shows you open, closed and total tickets for each week. This helps you understand the direction in which your projects are going.

Put this to use!
If you are opening tickets faster than you close, you are never going to make it! If your total tickets line is going upward, you are adding tickets after your initial plan. In ideal situation, open tickets will move downwards, closed tickets will move upwards and total tickets will remain steady.

Installing Reports Module

February 12, 2009

Installation

The first step in installing Reports module is to upload it to your server. To do this, extract Reports module installation package and upload contents of /for-upload folder to your server using FTP or SFTP client. Make sure you upload this folder in your activeCollab installation folder.

Once that is done, log in to your activeCollab installation and go to Modules administration.

available-modules-reports

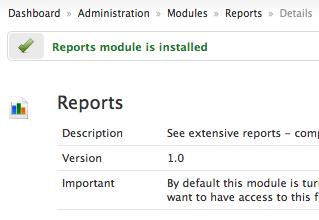
You will see Reports in the available modules list. Click on Install button. The module will install and create reporting data for your projects. If you have a lot of projects, this may take a while.

reports-module-installed

Once the Reports module is installed, there is one more step before we can use it.

Configuration

Permissions to Roles

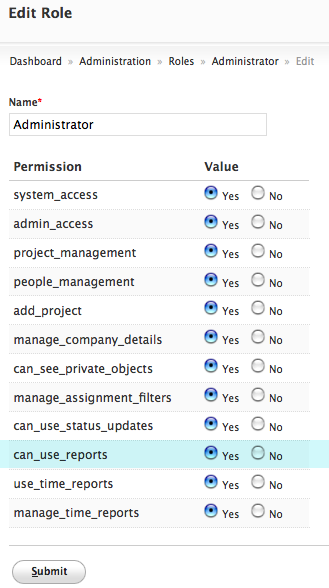
Go to Administration - Roles. Edit a System Role that you want to give access to Reports module to. Check Yes on can_use_reports and Submit. All people with this role will now start seeing a Reports icon in main menu.

editing-role

Scheduled Tasks

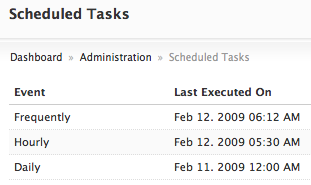
One more thing we want to confirm now is that Scheduled Tasks are working. Go to Administration - Scheduled Tasks. If you see some date / times on Daily schedule, we are set. If not, please configure Scheduled Tasks.

scheduled-tasks

We are all set then. Click on Reports menu to see what you get.

reports-icon-in-main-menu

Reports module for activeCollab

February 11, 2009

This page is no longer updated.

Reports module 1.6 is live. The new version adds People reports, Company reports, Usage statistics and vastly improved interface. Please click here to learn about the latest release of Reports Module.

  • Do you want to track progress of your projects week by week?
  • Would you like a dashboard that shows you this progress graphically, for all projects from a single screen?
  • Would you like to track hours worked, kind of work done, trends of work from the same place?

Our activeCollab Reports Module gives you all of that!

reports-overview-scaled

Reporting Dashboard

We can bet it will save you more money than it’s price! Only $69!
Buy Now

Features:

  • Quickly see your project’s velocity – even velocity of all projects combined
  • Impressive collection of charts – Burndown Chart, Iteration Chart, Hours Chart
  • Additional Information to track project progress – Most Active Tickets, Longest Open Tickets and Pages
  • Print reports
  • Daily / Weekly progress measurement
  • View reports for given date range
  • Simple and elegant user interface
  • One click, no hassle installation
  • Translate in your own language
  • Works with activeCollab (1.1+ & 2.1+) – one of the best web-based project management systems
  • It’s only $69, worth it even if you track one project with it!

Next Actions