Burndown Chart
Burn down Chart

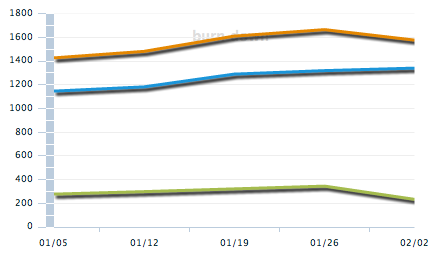
Shows you open, closed and total tickets for each week. This helps you understand the direction in which your projects are going.
Put this to use!
If you are opening tickets faster than you close, you are never going to make it! If your total tickets line is going upward, you are adding tickets after your initial plan. In ideal situation, open tickets will move downwards, closed tickets will move upwards and total tickets will remain steady.


Recent Comments