Archive for category: activeCollab
Reports Module Documentation
Welcome to this introduction to Reports module for activeCollab. In this quick article, we will see how to install, use and make decisions with this exciting new module for activeCollab – a superb project management system.

Let’s get started.
Documentation Subjects
Click on a subject to learn more about it.
- Installation, Configuration & Scheduled Tasks
- Charts: Burndown Chart, Iteration Chart, Hours Chart
- Useful Info: Most Active Tickets, Longest Open Tickets, Project Velocity
- How do we create these reports?
- Filtering by dates, Navigating projects and Legends
Introduction Video
We have a superb introductory video on Reports module. In well under 5 minutes, you can learn how to setup and use Reports module with your activeCollab setup!
Need Support? Have an idea?
Do you have some feedback for us? An idea to improve? Some problem we missed out? We are eager to listen. Please give us your feedback.
Filtering by dates, Navigating projects and Legends
Reports Dashboard Options
Filter by Dates
![]()
You can filter reporting period by selecting dates in two date selectors at top. The first is starting date and second is end date. Click on the calendar next to a date field to select another date. Click on Refresh button to reload reports for this date range.
Navigating Projects
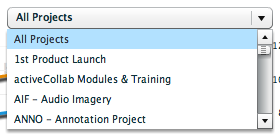
At the top of your Reports Dashboard, you will see a drop down list of projects you have access to. Select any project from this list and click on Refresh to update reports.
![]() We anticipated that you may want to review all your projects once a week. We simplified this operation with the
We anticipated that you may want to review all your projects once a week. We simplified this operation with the Next button. Click on Next to load reports for next project in your list. Review reports and click Next again to move to another project.
Legends
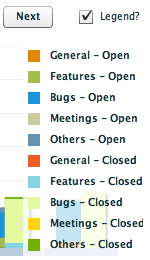
We did not want legends to obstruct your view, so we kept them hidden. You can toggle them by checking the Legend box at top right. When on, this will show you color code legends for all your charts.
How do we create these reports?
Background Magic

We create these reports by taking a snapshot of your projects. We store reporting trends for last week at the start of each week. This is how we get weekly progress reports. And this is the reason why we need Scheduled Tasks running!
This data – burndown, iteration, hours – is not updated during a week. So if you come back to these reports during a week, you will not see any updates. The only real time data is Most Active Tickets and Longest Open Tickets.
Project Velocity
Project Velocity
![]()
Velocity is the number of tickets closed last week. Burn down chart’s Closed Tickets line is your velocity trend. Project Velocity is one of your best measurement of project progress. A high number means team is progressing well.
Velocity can be linked to different parameters. Some project management methodologies calculate it by dividing estimated time with actual time. Since we don’t have a way to estimate time in activeCollab yet, we are simply using ticket counts.
Put this to use!
Track your velocity trend. If it falls, it means there is some struggle with, things have slowed down. It could be waiting for client feedback or some risks that have come up. If nothing else, you should track velocity on your projects.
Longest Open Tickets
Longest Open Tickets

Tickets that are open for longest duration – along with number of days they have been open for.
Put this to use!
Longest tickets may mean work your team is struggling with or neglecting. Are these tickets important? Longest tickets could also show items that you use for recurring activities like meetings. May be they are risks that have not yet been addressed. Work on closing them at priority!
Most Active Tickets
Most Active Tickets

Which tickets have most comments back and forth? Which are updated most frequently? Most active tickets show 5 tickets with highest activity.
Put this to use!
Active tickets could be unclear work items. Does the team need help on them? Or are they items that needed focus and are getting it now?
Iteration Chart
Iteration Chart
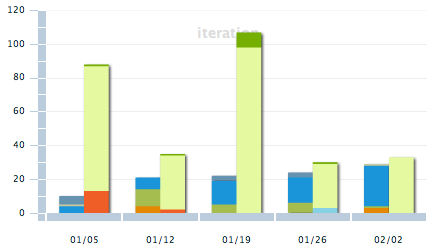
Iteration chart shows you number of open and closed tickets in different categories. This helps you assess what kind of work is getting done every week. Categories are pulled from your Master Categories list in activeCollab.
Put this to use!
If you see open tickets rise in a week, it means work has increased. Closed counts increasing is a good sign – it means things are getting done. Depending on how you have organized your categories, this chart can give you a bird’s eye view of progress on your projects.
Burndown Chart
Burn down Chart
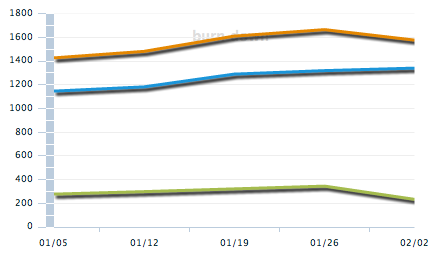
Shows you open, closed and total tickets for each week. This helps you understand the direction in which your projects are going.
Put this to use!
If you are opening tickets faster than you close, you are never going to make it! If your total tickets line is going upward, you are adding tickets after your initial plan. In ideal situation, open tickets will move downwards, closed tickets will move upwards and total tickets will remain steady.
Installing Reports Module
Installation
The first step in installing Reports module is to upload it to your server. To do this, extract Reports module installation package and upload contents of /for-upload folder to your server using FTP or SFTP client. Make sure you upload this folder in your activeCollab installation folder.
Once that is done, log in to your activeCollab installation and go to Modules administration.
![]()
You will see Reports in the available modules list. Click on Install button. The module will install and create reporting data for your projects. If you have a lot of projects, this may take a while.
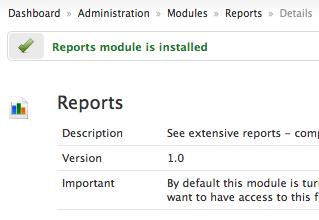
Once the Reports module is installed, there is one more step before we can use it.
Configuration
Permissions to Roles
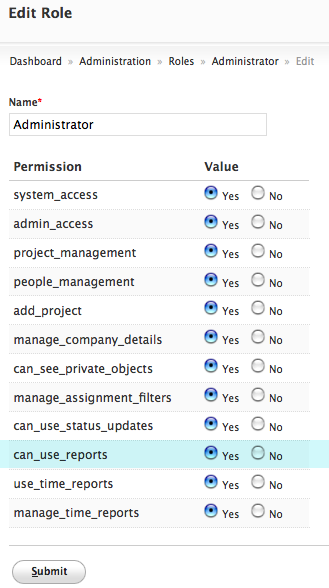
Go to Administration - Roles. Edit a System Role that you want to give access to Reports module to. Check Yes on can_use_reports and Submit. All people with this role will now start seeing a Reports icon in main menu.
Scheduled Tasks
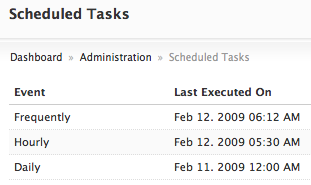
One more thing we want to confirm now is that Scheduled Tasks are working. Go to Administration - Scheduled Tasks. If you see some date / times on Daily schedule, we are set. If not, please configure Scheduled Tasks.
We are all set then. Click on Reports menu to see what you get.
![]()


Recent Comments