Filtering by dates, Navigating projects and Legends
Reports Dashboard Options
Filter by Dates
![]()
You can filter reporting period by selecting dates in two date selectors at top. The first is starting date and second is end date. Click on the calendar next to a date field to select another date. Click on Refresh button to reload reports for this date range.
Navigating Projects

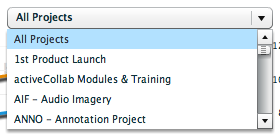
At the top of your Reports Dashboard, you will see a drop down list of projects you have access to. Select any project from this list and click on Refresh to update reports.
![]() We anticipated that you may want to review all your projects once a week. We simplified this operation with the
We anticipated that you may want to review all your projects once a week. We simplified this operation with the Next button. Click on Next to load reports for next project in your list. Review reports and click Next again to move to another project.
Legends

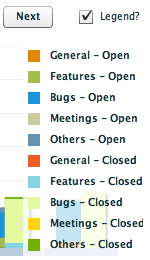
We did not want legends to obstruct your view, so we kept them hidden. You can toggle them by checking the Legend box at top right. When on, this will show you color code legends for all your charts.


Recent Comments