Iteration Chart
Iteration Chart

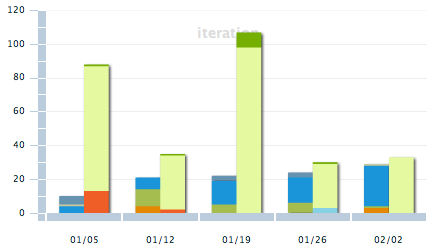
Iteration chart shows you number of open and closed tickets in different categories. This helps you assess what kind of work is getting done every week. Categories are pulled from your Master Categories list in activeCollab.
Put this to use!
If you see open tickets rise in a week, it means work has increased. Closed counts increasing is a good sign – it means things are getting done. Depending on how you have organized your categories, this chart can give you a bird’s eye view of progress on your projects.


Recent Comments